City comparison
Columbia, SC vs Reno, NV
What a paycheck is really worth in each city: prices, rent and state taxes.
Key findings
- Prices in Reno, NV are 7.8% higher than in Columbia, SC. Someone earning $100,000 in Columbia, SC would need about $107,800 in Reno, NV to live the same way.
- Rent is the bigger story: a typical 1-bedroom costs $1,489 a month in Reno, NV versus $1,164 in Columbia, SC. On $100,000, that's 23% of take-home pay in Reno, NV and 19% in Columbia, SC.
- On $100,000, estimated state income tax is about $4,843 a year higher in Columbia, SC than in Reno, NV.
- For federal employees, locality pay changes a GS-13 step 1 salary by +0.4% moving from Columbia, SC to Reno, NV ($106,437 → $106,855), while prices change by +7.8%. Net effect of the transfer: −6.9% in real buying power.
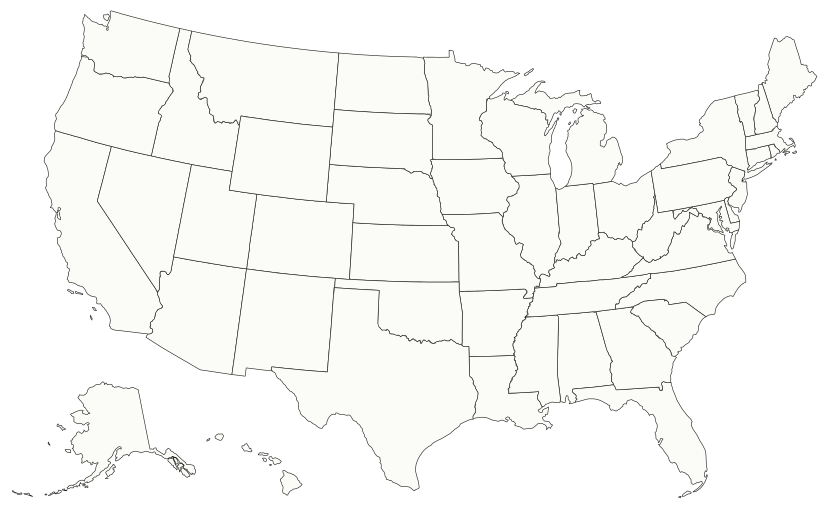
- Columbia, SC: price level 93.7 (cheaper)
- Reno, NV: price level 101.0 (about average)
Map drawn from Census Bureau state boundaries and metro locations9,10; dot colours show BEA price levels2.
Side by side
| Columbia, SC | Reno, NV | |
|---|---|---|
| Price level (U.S. = 100)2 | 93.7 | 101.0 |
| $100,000 is worth, in the other city2 | $107,850 in Reno | $92,722 in Columbia |
| Typical 1-bedroom rent3 | $1,164/mo | $1,489/mo |
| Take-home on $100,00014,15,8 | $74,337 | $79,180 |
| State income tax on $100,000 (estimate)8 | $4,843 (SC) | $0 (NV) |
| Rent burden on $100,000 | 19% | 23% |
| Median pay, all jobs4 | $46,430 | $49,660 |
| Federal locality pay area7 | Rest of U.S. | Reno-Fernley, NV |
Rent areas: Columbia, SC HUD Metro FMR Area and Reno, NV HUD Metro FMR Area. Metro areas: Columbia, SC and Reno, NV.
What costs more or less
| Price level (U.S. = 100) | Columbia | Reno |
|---|---|---|
| Housing (rent) | 79.5 | 123.5 |
| Goods | 96.3 | 96.3 |
| Utilities | 88.3 | 89.3 |
| Other services | 98.3 | 98.7 |
| Overall | 93.7 | 101.0 |
Moving with the same $100,000 salary
Columbia, SC → Reno, NV
Same pay buys less
Buying power −7.3%; rent takes 23% of take-home; state tax −$4,843/yr.
46 Fair offer
Reno, NV → Columbia, SC
Same pay goes further
Buying power +7.8%; rent takes 19% of take-home; state tax +$4,843/yr.
93 Strong offer
On the GS pay scale?
Columbia, SC is in the Rest of U.S. pay area; Reno, NV is in Reno-Fernley, NV. The last column shows what a transfer from Columbia, SC to Reno, NV at the same grade and step does to real buying power.
| Grade5,2 | Columbia, SC | Reno, NV | Real change, Columbia → Reno |
|---|---|---|---|
| GS-9 step 1 | $61,722 | $61,965 | −6.9% |
| GS-11 step 1 | $74,678 | $74,972 | −6.9% |
| GS-12 step 1 | $89,508 | $89,859 | −6.9% |
| GS-13 step 1 | $106,437 | $106,855 | −6.9% |
| GS-14 step 1 | $125,776 | $126,271 | −6.9% |
Pay for common jobs
| Median annual pay4 | Columbia, SC | Reno, NV | Reno pay in Columbia dollars |
|---|---|---|---|
| Elementary School Teachers, Except Special Education | $60,050 | $62,430 | $57,886 (−3.6%) |
| Software Developers | $123,380 | $125,710 | $116,561 (−5.5%) |
| Accountants and Auditors | $69,210 | $82,370 | $76,375 (+10.4%) |
| Registered Nurses | $81,920 | $107,520 | $99,694 (+21.7%) |
"Not published" means BLS doesn't release an estimate for that job in that metro.